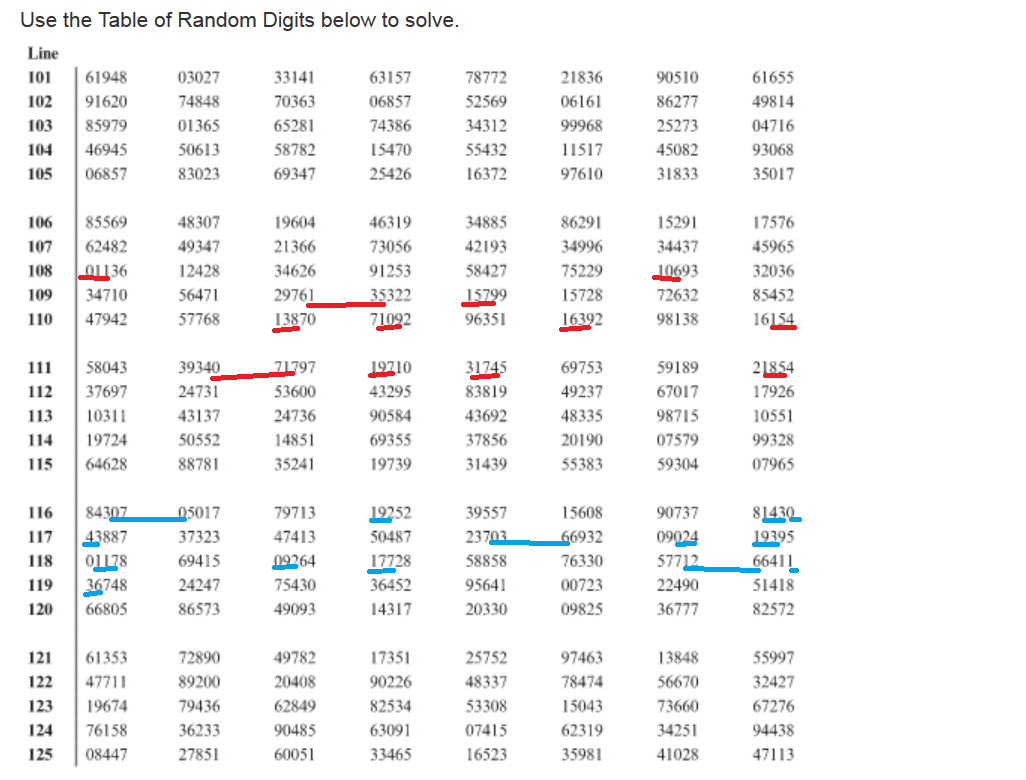
As you can see from the underlined table (red for part (1) and blue for part (2)) , the numbers you want, 6 from each category for the first part, are:
Clothing and Jewlery: 011, 106, 135, 138, 109, 071
Food and Services: 157, 163, 154, 197, 174, 185
In the second part, your sample should have \(\frac{1}{4} \times 12 =3\) stores from Food and Services category since one fourth of the population is in that category; the rest, 9 stores, should be in the other category. These are underlined in blue:
Clothing and Jewlery:070, 143, 043, 036, 024, 117, 092, 126, 136
Food and Services:192, 193, 177
It is very easy to make mistakes reading the random digits table, so you should double check my answers. All you do is start at the line suggested and look at three digits at a time from left to right and select the ones that are in the range of IDs assigned to the stores. Read the table as if the digits followed one another in a continuous stream with no gaps for columns and no breaks for lines because in reality that is how it is and the digits are arranged in columns to give your eyes reference points.