 +9495
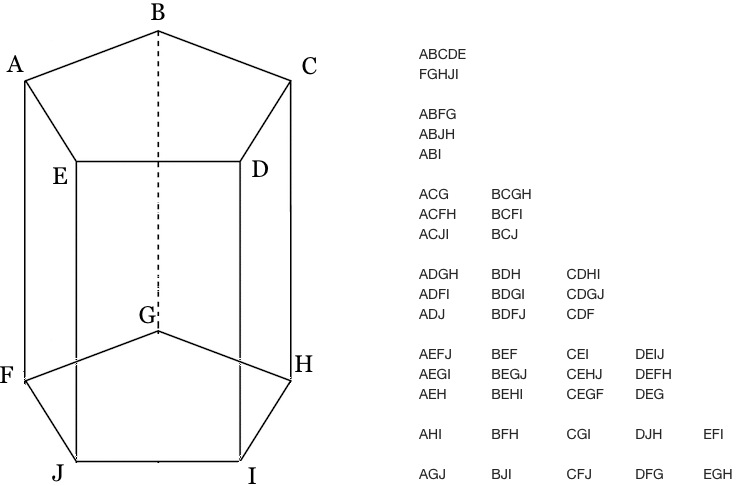
+9495 If A = {2, {4, 5}, 4}, true or false:
| statement | restating the statement | answer | _____because... |
| |
| 1.___ | {4, 5} ⊂ A_____ | {4, 5} is a subset of A | _____False_____ | 5 is not an element of A. | |
| 2. | {4, 5} ∈ A | {4, 5} is a element of A | True | The set {4, 5} is an element of A. |
|
| 3. | {{4, 5}} ⊂ A | {{4,5}} is a subset of A | True | The set {4, 5} is an element of A. | |
| 4. | {2} ⊂ A | {2} is a subset of A | True | 2 is an element of A |
|
| 5. | {2} ∈ A | {2} is an element of A | False | The set {2} is not an element of A. | |
| 6. | 2 ∈ A | 2 is an element of A | True | 2 is an element of A |
|
| 7. | {{4, 5}} ∈ A | {{4, 5}} is an element of A | False | The set of the set {4, 5} is not an element of A |
Our answers are different on 1 and 3.
Also...I don't know if the ⊂ symbol means a proper subset or just a subset, but it doesn't really matter for these questions.
+9495 1.
Graph the function \(f(x)=\begin{cases} x+6 & x\leq -4 \\ (x+2)^2-3 & -4< x\leq 1\\ -|x-4|+5 & x>1 \end{cases} \)
Here's the graph of the function on desmos:
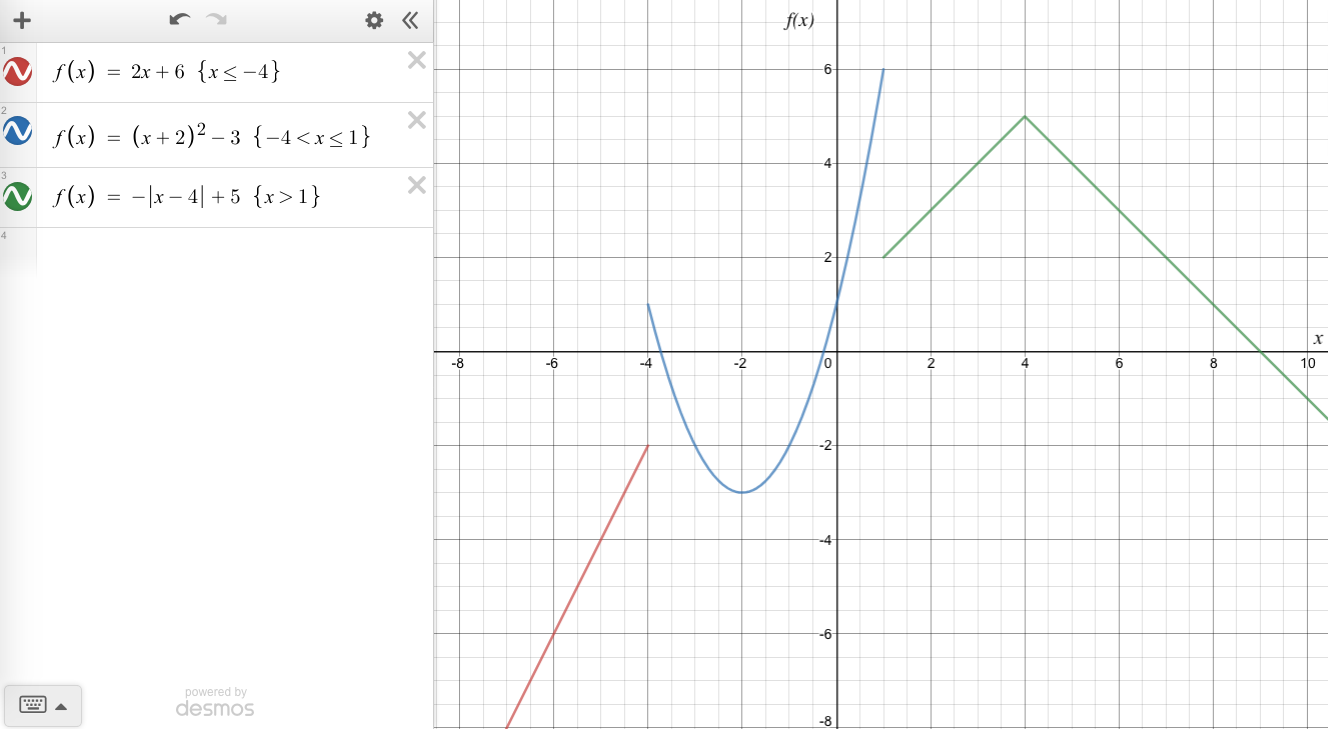
https://www.desmos.com/calculator/de2hbs4llz
Notice that the way to specify an interval on desmos is by putting it inside { }'s at the end of the equation.
What is the value f(x) = -3 ?
I think this is asking what x values make f(x) be -3.
On the graph, we can look for values of x that make f(x) be -3 .
There are three different x values that make f(x) be -3.
f( -4.5 ) = -3
f( -2 ) = -3
f( 12 ) = -3
Explain how you would graph something like this without using Desmos:
You could plot points, making sure to plot points within each of the three intervals, and using the knowledge that the first piece is a part of a line, the second piece is a part of a parabola, and the fourth piece is a part of an absolute value graph.
+9495 We can arrange them like this so there is only one unused square:
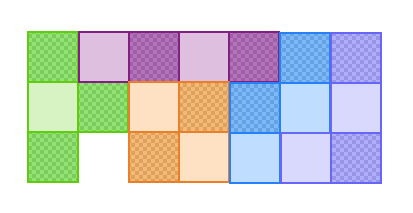
I could not figure out how fit them together so there were no unused squares.
After reading about "tetrominoes" on Wikipedia, I found out that the 5 pieces above are the 5 "free tetrominoes," and "Although a complete set of free tetrominoes has a total of 20 squares, they cannot be packed into a rectangle." See:
https://en.wikipedia.org/wiki/Tetromino#Tiling_the_rectangle_and_filling_the_box_with_2D_pieces
the least possible area of the rectangle = 3 * 7 = 21 squares
+9495 a)
x = 2√2 cos θ
y = 2 sin θ
x = 2√2 cos θ
Square both sides of this equation
x2 = 8 cos2 θ
Divide both sides by 8.
x2 / 8 = cos2 θ
y = 2 sin θ
Square both sides of this equation.
y2 = 4 sin2 θ
By the Pythagorean identity, we can substitute (1 - cos2θ) in for sin2θ
y2 = 4(1 - cos2θ)
Substitute x2 / 8 in for cos2θ
y2 = 4(1 - x2 / 8)
Divide both sides of the equation by 4 .
y2 / 4 = 1 - x2 / 8
Add x2 / 8 to both sides of the equation.
x2 / 8 + y2 / 4 = 1
Here is what the ellipse looks like:
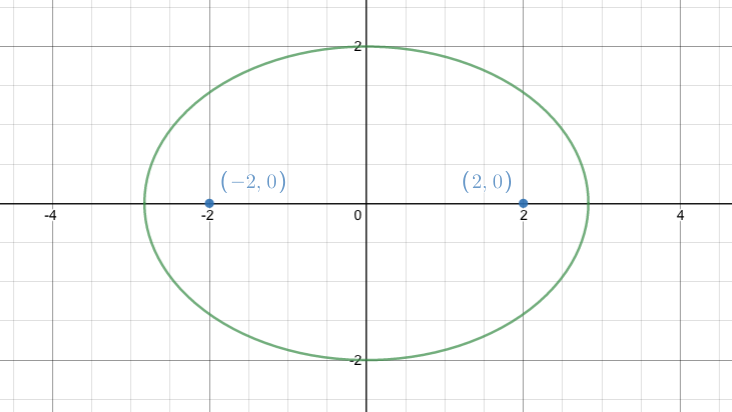
https://www.desmos.com/calculator/o8fvqgkljx
the distance from the center of the ellipse to a focus = c
c2 = a2 - b2 = 8 - 4 = 4
c = √4 = 2
the foci are located at (0 + 2, 0) and (0 - 2, 0)
the foci are located at (2, 0) and (-2, 0)