+2447
+2447 I think the best thing to do here is to construct a diagram. The problem gives you vertices with coordinates from the Cartesian plane, and it even gives you an inequality. Here is the construction I created. I will reference it throughout the solving process:
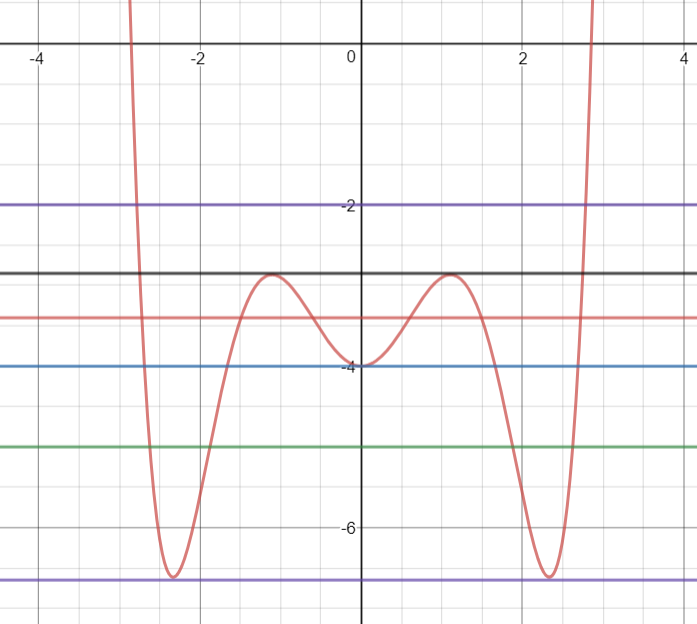
I first located the given coordinates and connected them with vertical and horizontal lines. I then graphed the inequality\(x>7y\), which can be rewritten as \(y<\frac{x}{7}\) . I added a few points, as they will become relevant when I solve.
One way to solve this problem is to figure out the ratio of the area created by the inequality \(y<\frac{x}{7}\) and the sides of the rectangle to the area of the entire rectangle. I will do this by first finding the coordinates of the point E. Point E is located on \(\overline{BC}\) , so its x-coordinate is also 2009. If you know the x-coordinate, then the y-coordinate of any point on \(y=\frac{x}{7}\) is \(\frac{x}{7}\) . Therefore, the y-coordinate is \(\frac{2009}{7}\) .
The formula for the area of the triangle is \(\frac{1}{2}bh\) . \(\triangle ABE\) is a right triangle, so the base and height are the side lengths that are not the hypotenuse. We know the length of the base, \(AB\) , because it is in the diagram. The height is the length of \(BE\) , or \(\frac{2009}{7}\)
\(A_{\triangle}=\frac{1}{2}*AB*BE=\frac{1}{2}*2009*\frac{2009}{7}=\frac{2009^2}{14}\)
We can also calculate the area of the rectangle
\(A_{\text{rect.}}=bh=AB*BC=2009*2010\)
As aforementioned, the probability of (x,y) such that x>7y is just the ratio of these areas.
| \(P(x,y|x>7y)=\frac{A_{\triangle}}{A_{\text{rect.}}}\) | As aforementioned, the probability of (x,y) such that x>7y is just the ratio of these areas. Substitute in the values and simplify. |
| \(P(x,y|x>7y)=\frac{\frac{2009^2}{14}}{2009*2010}\) | Use algebraic manipulation to simplify this. |
| \(P(x,y|x>7y)=\frac{2009^2}{14*2009*2010}\) | |
| \(P(x,y|x>7y)=\frac{2009}{14*2010}\) | At this point, you must use a calculator. |
| \(\)\(P(x,y|x>7y)=0.07139\) | |
 +118735
 I think questions like this one are always really hard to understand and I would like another mathematician to check my answer.
Use my pic, which is near enough to the same.
Think about a horizontal line through the graph.
At the top it will pass through the graph twice so g(c)=2
Here is a pic
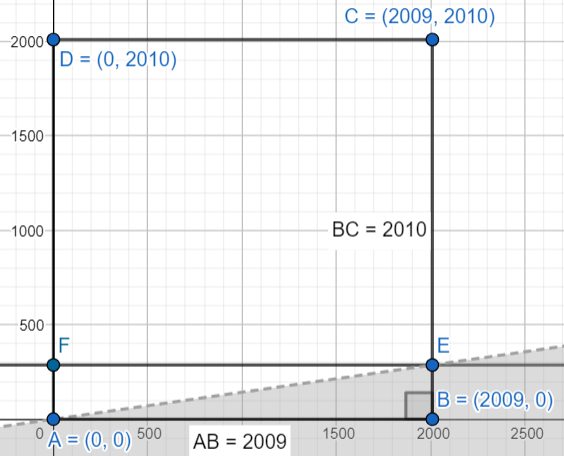
I have drawn six horizonal lines.
For the top (purple - 1st ) one f(x)=-2
this crosses the graph f(x) at 2 different x values so g(-2)=2
the next horizontal line (black 2nd ) palsses through 4 points so g(-2.8)=4
the 3rd horizontal line (red ) palsses through 6 points so g(-3.4)=6
the 4th horizontal line (blue ) palsses through 5 points so g(-4)=5
the 5th horizontal line (green) palsses through 4 points so g(-5)=4
the bottom horizontal line (purple ) palsses through 2 points so g(-6.7)=2
So g(c) can be 2, 4, 5, or 6
The average of the distict values of g(c) = (2+4+5+6)/4 = 17/4 = 4.25
I am pretty sure that is correct.
Here is the graph I used https://www.desmos.com/calculator/ft9bo78w4l
You do not need it though.