
 +130
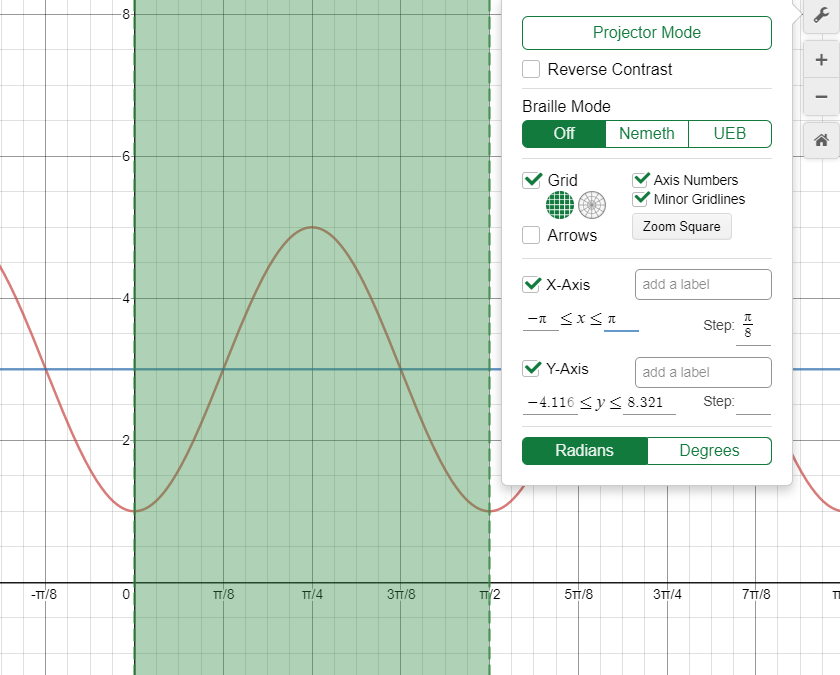
+130 Equation: y = -2 cos 4 x + 3
Desmos Graph: https://www.desmos.com/calculator/e5jilhrvfk
---------------------------------------------------------------------------------------------------------------------------------
- Questions -
1) Midline: y = 3 yes
2) Topline: 5 y=5 It is a line!
3) Bottom Line: 1 y=1
4) Wavelength: π/2 2pi/4 = pi/2 GOOD
5) Quarter Of The Wavelength: π/4 X one quarter of pi/2 IS NOT pi/4 \(\frac{1}{4}*\frac{\pi}{2}=\frac{\pi}{8}\)
6) What would be sensible points for the x-axis? π/4, 3π/4, 5π/4, 7π/4, 9π/4 (?)
pi/8, 2pi/8=pi/4, 3pi/8, 4pi/8=pi/2 etc
7) Will it start on the midline, above or under, why? It will start below the midline because it is a cos graph.
NO Sin graphs start in the middle because sin0=0
+cos0=1 -cos0=-1 This equation has the minus sign so it will start (cross the y axis) at the bottom.
8) Will is start going down or going up, why? It has begun at its lowest point as a cos graph and will begin upwards.
Up because it is is already at the bottom.
9) y-intercept: 1 YES (this is the bottom!)
10) Plot 4 (or 5) points in advance just by knowing what the properties of the graph will be.
I mean maxima, minima, and points on the midline: (π/8, 3), (3π/8, 3), (5π/8, 3), (7π/8, 3), (9π/8, 3) [Or] (π/4, 5), (3π/4, 5) [Etc] (0,1)
11) Graph it from x = 0 to x = Wavelength: ✔
12) What is the first maxima? (π/4, 5)
13) What is the first minima? (π/2, 1)
14) What are points on the midline? (π/8, 3), (3π/8, 3), (5π/8, 3), (7π/8, 3), (9π/8, 3) (?)
Good but I also wanted the ones at the top and bottom (0,-1), pi/4,5), (pi/2,-1)
Look at the graph.
Hopefully these are all correct! You are getting there :)
You need to do a freehand sketch as you answer the questions. They will complement each other and make it easier.
Here is a graph with a better step on the x axis. I have made the x step equal to one quarter of a wave.
https://www.desmos.com/calculator/lh4pzfxeja
I have only added the shaded green so that you can easily see one wavelength.
See how it starts at the bottom.
when x=0 y=-2cos(4*0)+3 = -2*1+3 = 1 (which is at the bottom of the wave)


 ! asinus


