Thanks ElecteicPavlov , I will take a look independently of you :)
WHAT IS THE MAXIMUM AND MINIMUM OF y=-3cos(2(x - pi/4))-1 and how to graph this function on paper??
The -3 means that the amplitude, distance from the centre, is |-3|=3
so
y=-3cos(2(x - pi/4)) would go from y=-3 to y=3
BUT the -1 at the end drops the graph by 1 unity so the y values will go from -4 to 2
------
What about the x values ??
Consider y=cosx this has a period (wavelength) of 2pi, and max y=+1 miny=-1
The maximums are at x=0, x=2pi, x=2npi where n is an integer.
The minimums are half way inbetween, x=pi, x=3pi etcThe
now look at
----------------------------------------------
y=cos(2x)
The period is now 2pi/2 = pi
so
The maximums are at x=0, x=pi, x=npi where n is an integer.
The minimums are half way inbetween, x=pi/2, x=3pi/2 etc
But there is also a phase shift. The -pi/4 moves the graph pi/4 places in the positive direction
so
The maximums are at x=0+pi/4, x=pi+pi/4, x=npi where n is an integer.
That is x=pi/4, 5pi/4 etc
The minimums are half way inbetween, x=pi/2+pi/4, x=3pi/2+pi/4 etc
That is x= 3pi/4, x=7pi/4 etc
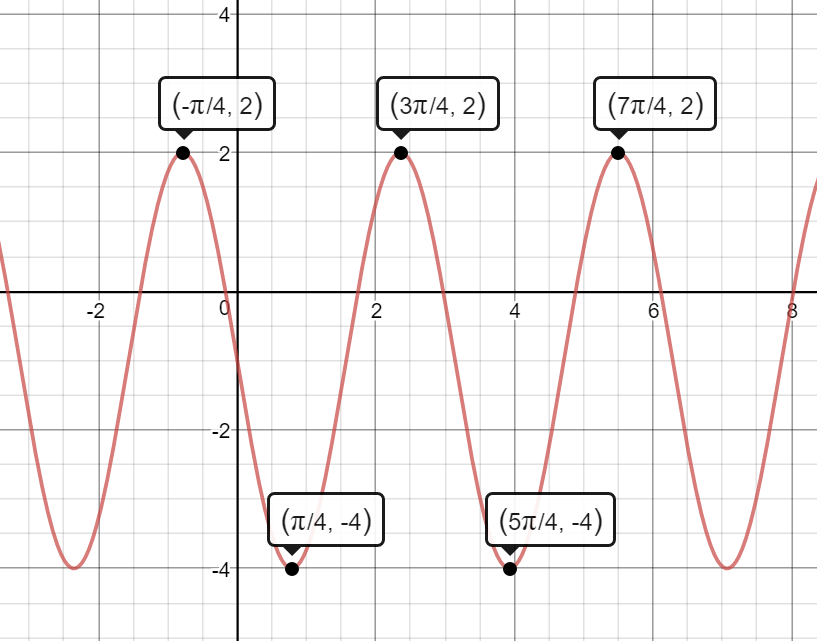
so we have Maximums, (pi/4, 2), (5pi/4,2) etc
and the minimums are (3pi/4,-4) (7pi/4,2)
-----------------------------------------------
Oh, I almost forgot about the NEGATIVE sign at the front. That turns the whole graph upside down. I mean it reflects it about y=0 which is the x axis. but that was BEFORE we dropped the whole graph by -1.
so
so we have MINIMUMS, (pi/4, -4), (5pi/4,-4) etc
and the MAXIMUMS are (3pi/4,2) (7pi/4,2) etc
This is displayed better in the interactive graph below. Make sure you look at it and learn all that you can from it.
You have to click into the site.
Lets see how I would have 'grown' this graph.
Click the buttons down the side to show the graphs one by one ans you will see how I have 'built' the graph from the basic starting point of y=cosx
https://www.desmos.com/calculator/swwpidnui6

 +118737


 )
)