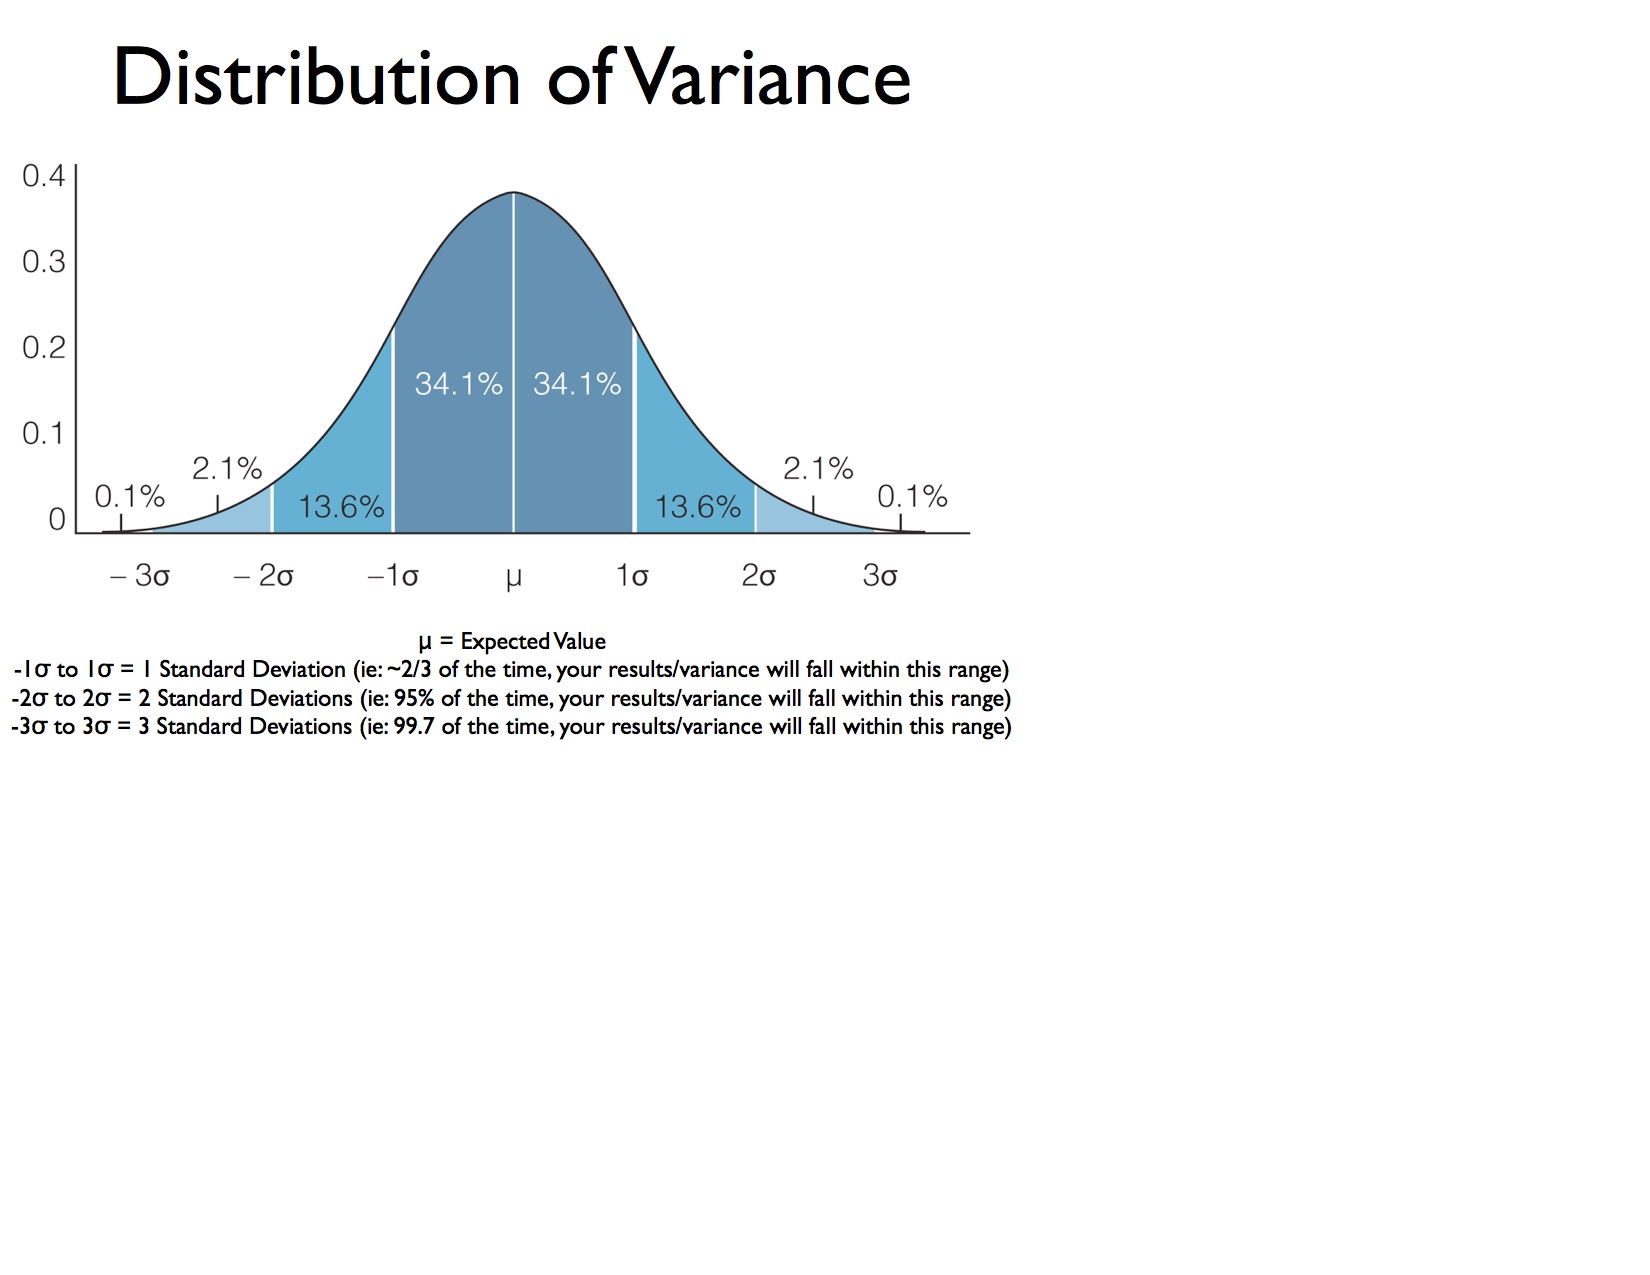
Here is a picture of a bell curve:
The vertical lines are each a standard deviation line. The mean is the high point of the curve....one standard deviation to the right involves 34.1% of the total # in the set ....one standard deviation below the mean is also 34.1 % of the total number in the set. etc It would be wise to commit to memory the percentages that each standard deviation represents.....
To your question: mean 71 standard deviation 6
76 is 5 points above the mean (5 points)/ (6 point standard dev) = .833 standard deviations above the mean...... z-score is thus +.833 The vertical line representing her score would be very close to the first line to the RIGHT of the mean.......
You will have to look at a z-score table to see ACTUAL percentage of students that she scored higher than BUT you should be able to see that she did better than everyone to the LEFT of her score approx 34.1 % + 34.1% + 13.6% + 2.1% + .1% = 84% She scored bette than approximately 84 % of the total number of students who took the test. Look at a + z-score table...... look at z-score = + .83 and read the number .7967 <------- this is the ACTUAL fraction of students to the LEFT of her score : 79.67% (our previous 84% was an approximate).
If she scored better than 79.67% ....then 20.33% scored HIGHER than her 20.33% x 85 students = ~17 students scored higher than her.