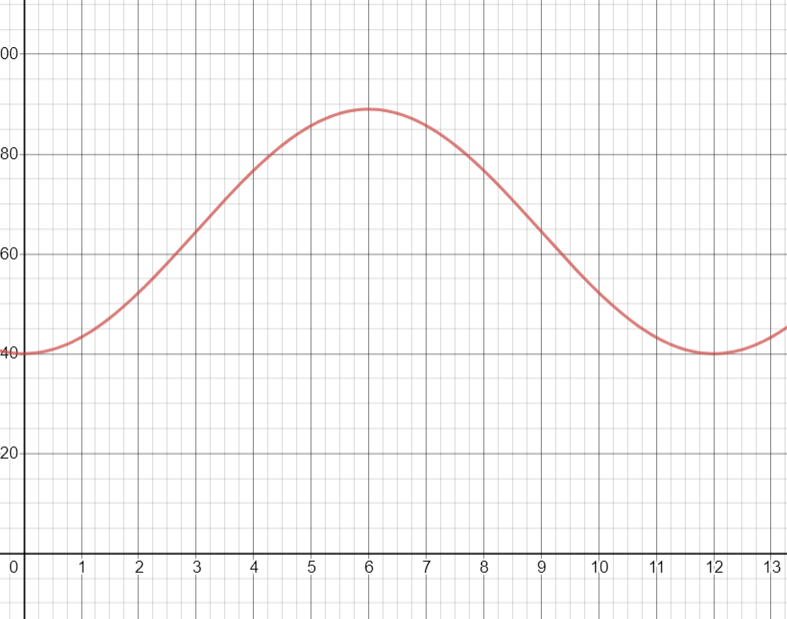
The period is 12 because there are 12 months in a year.
The lowest temp is 40 degrees in January
The highest is 89 in july (6 months later)
The average of these is (40+89)/2 = 129/2 = 64.5
89-64.5 = 24.5
y=-24.3cos(nx)
12=2pi/n
n=12/(2pi) = 6/pi
\(y= -24.5 cos \frac{\pi x}{6}+64.5 \qquad\text{The angle is in radians}\\\)
Here is the graph
Oh dear this is meant to be a sinusoidal graph.
The sine curve is just this with a phase shift of a quarter of a period (3 months)
\(y= -24.5 cos \frac{\pi x}{6}+64.5 \qquad\text{The angle is in radians}\\ y= -24.5 sin \frac{\pi }{6}(x+3)+64.5 \\ or\\ y= 24.5 sin \frac{\pi }{6}(x-3)+64.5 \)
Here are the graphs
https://www.desmos.com/calculator/qttbu1fohw

 +118739


