+2447
+2447 We have two pieces of data from a study from separate groups.
In order to create the baseline, it is necessary to find the difference of the individual means of both data.
\(\text{Sedentary: }\overline{x}_1=56.5, SD_1=14.1,s_1=55\\ \text{Manual: }\overline{x}_2=51.3,SD_2=13.5,s_2=50\)
SD = sample standard deviation
s1 and s2 are the individual values for sampling size.
Since the question asks for the difference between the population means, one should do that in order to create a baseline.
\(\mu_{\overline{x}_1-\overline{x}_2}=\overline{x}_1-\overline{x}_2=56.5-51.3=5.2\)
This is the exact middle of the data. In order to establish a 95% confidence level of the difference, we will have to find the number of standard deviations from the current \(\mu_{\overline{x}_1-\overline{x}_2}\) . We can utilize the empirical rule (sometimes referred to the 68-95-99.7% rule) for this. An image will probably do the best explaining.

Source: http://simulation-math.com/_Statistics/EmpiricalRule.png
This image indicates to me that 95% of the data falls within 2 standard deviations from the mean. Because a bell-shaped distribution is symmetric in nature, we know that, from the mean, 95% will fall between \(\pm2\sigma_{\overline{x}_1-\overline{x}_2}\) . By calculating this information, there should be a 95% chance that 5.2 (the \(\mu_{\overline{x}_1-\overline{x}_2}\)) lies within \(\pm2\sigma_{\overline{x}_1-\overline{x}_2}\) of the mean. Now, we must find that standard deviation. Let's use some algebra manipulation to find a formula for this.
| \(\sigma_{\overline{x}_1-\overline{x}_2}^2=\sigma_{\overline{x}_1}^2+\sigma_{\overline{x}_2}^2\) | In other words, the variance of the means of the distribution equals the sum of the variance of each sampling distribution. We can rewrite this equation further because the variance of each sampling distribution also equals the variance of the population distribution divided by the sampling size. |
| \(\sigma_{\overline{x}_1-\overline{x}_2}^2=\frac{\sigma_{x_1}^2}{s_1}+\frac{\sigma_{x_2}^2}{s_2}\) | There is only one problem: We do not know the sample variances. However, we can approximate by using the values from the sample standard deviations instead. |
| \(\sigma_{\overline{x}_1-\overline{x}_2}^2=\frac{SD_{1}^2}{s_1}+\frac{SD_{2}^2}{s_2}\) | Now, solve for sigma by taking the square root of both sides. |
| \(\sigma_{\overline{x}_1-\overline{x}_2}=\sqrt{\frac{SD_{1}^2}{s_1}+\frac{SD_{2}^2}{s_2}}\) | Now, plug in the values for variables in the equation. Normally, I would rationalize the denominators, but this is a calculator's job anyway, so it does not really matter. |
| \(\sigma_{\overline{x}_1-\overline{x}_2}=\sqrt{\frac{14.1^2}{55}+\frac{13.5^2}{50}}\) | |
| \(\sigma_{\overline{x}_1-\overline{x}_2}\approx 2.6944\) | This is the variance calculated to the nearest ten-thousandth place. Since 95% is two standard deviations away, we need to double this answer. |
| \(2\sigma_{\overline{x}_1-\overline{x}_2}\approx 2*2.6944\approx5.3888\) |
Remember this statement from earlier? I said there should be a 95% chance that 5.2 (the \(\mu_{\overline{x}_1-\overline{x}_2}\)) lies within \(\pm2\sigma_{\overline{x}_1-\overline{x}_2}\) of the mean. We can derive the interval with this. Therefore, 95% of the data lies within \(5.2\pm5.3888\) .
We are, therefore, 95% confident that the true mean lies between \(-0.1888\) and \(10.588\) .
I encourage you to try the next one! See how you do!
 +9495
+9495 Pick a state from the list.....for example, Nevada.
On a map, draw rectangles and triangles to roughly fill in the shape of the state, like this:

https://i.imgur.com/YmRsa0z.png
(To do that, I took a screenshot of the map and used paint to draw the shapes onto it.)
Next we want to find the length of each side of the shapes. To do that, the directions say to pick two cities and find the distance between those two cities.
Vya and San Jacinto are the best two cities I found for the north side of the rectangle. Then I used the measure distance tool on google maps to find that length. (To use the measure distance tool, right click on the starting point, select measure distance, and then click on the end point.)

https://i.imgur.com/vZAw8i1.png
Once you know the lengths of the sides of the shapes, calculate the area of each shape. (Remember to get the heights of non-right triangles.) Then add all the areas together to get an estimate of the area of the state.
Does that help get you started?

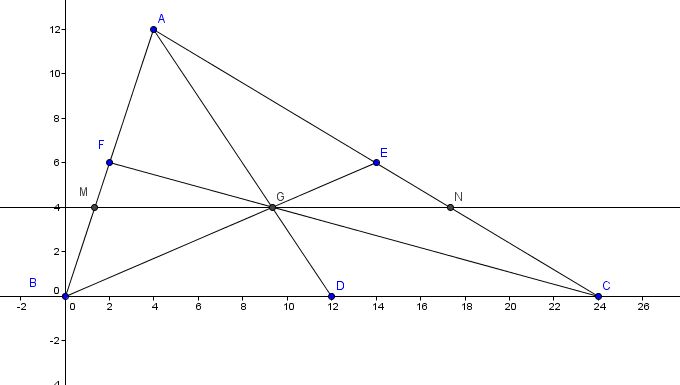 Let A = (4, 12)