g(x) = -2x , x ≥3
Let's just pick two x values ≥ 3 and stick them into the function
When x = 3, y = -6.....so....(3, -6) is on the graph
When x = 4, y = -8.....so.....(4, -8) is on the graph
Plot (3, -6)
Then...plot (4, -8).....draw a ray startting at (3, 6) and extend it through (4, -8)
g(x) = -(1/3)X - 5, x ≤3
Again..let's pick x = 3 and put it into the function....and we have (-1/3)(3) - 5 = -1 - 5 = -6
So....the point (3, -6) is on the graph
Now.....pick anoher x value < 3.......0 is good
So (-1/3)(0) - 5 = -5
So (0, -5) is on this graph
Draw a ray from (-3, 6) through (0, -5)
The graph will look like this :
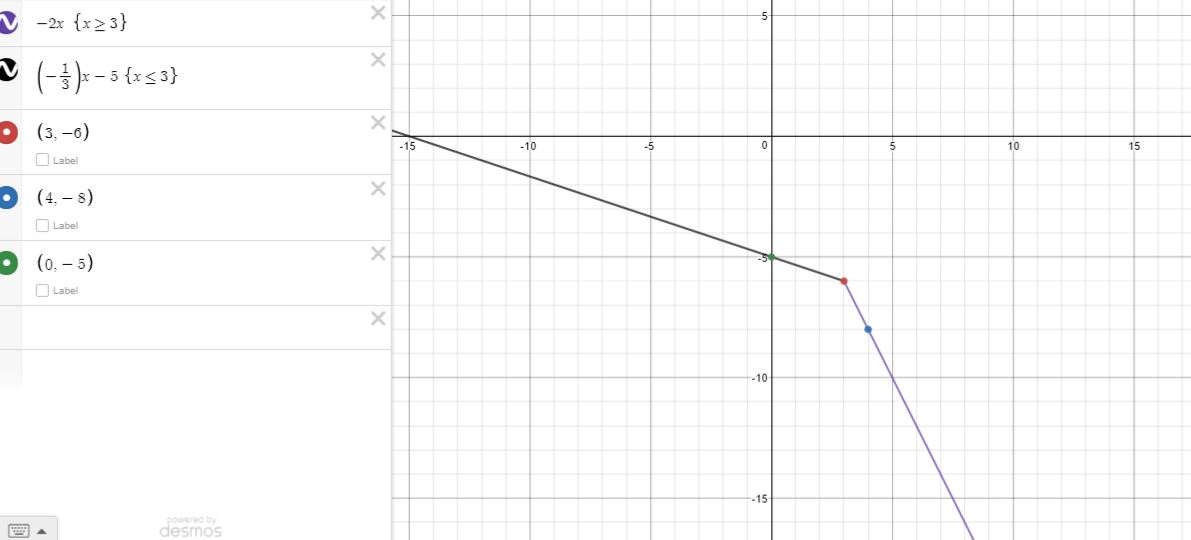
Of course...the lines (rays) will have "arrows" at their ends